Olympics Research Trends – Explore and Visualise the Science behind Human Performance August 12th, 2016, by Sadia Shahid
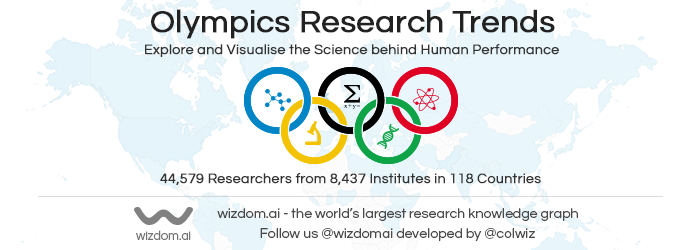
Visualise and explore the work of 44,579 superstar Researchers from 8,437 Research Institutions in 118 countries on every sport in the Olympics 2016 Research Dashboard by wizdom.ai, the world’s largest research knowledge graph powered by big data analytics, machine learning and artificial intelligence.
With all eyes set on the Rio Olympics 2016, the world witnesses the greatest display of human strength, endurance, dexterity and performance by participants from across the globe. Everyday over the course of the two weeks, over 11,400 athletes compete for the gold medal in their game. They have undertaken intensive training for months and years to reach the epitome of physical fitness and to optimise their performance, making every millisecond count.
Backing the Olympians that make it to the podium in every field, all along through their training there are thousands of researchers around the world who have extensively studied the games to raise the bar for human performance. To appreciate the scientific research behind the Olympics and to celebrate the efforts of researchers around the world, we applied big data analytics on the world’s largest research knowledge graph, wizdom.ai and presented the results in a comprehensive dashboard featuring the Olympic games. Yesterday in the light of the Rugby Finals, we announced a preview of our Rugby dashboard which was widely visited by researchers. athletes and sports fans internationally. Today, we are launching the Olympics Research Trends Dashboard featuring all sports, showcasing global research underpinning the Olympics.
The massive research activity around Olympic Sports at a global scale is undertaken by 44,579 researchers from 8,437 research institutions in 118 countries, publishing 19,158 research papers in 3,723 academic journals. In our Olympics Research dashboard, we have identified the top researchers in every sport from across countries to celebrate their achievements and efforts. Through content mining of research publications, we also identified some of the most studied concepts in Olympic sports such as the egg beater kick in water polo and the one-repetition maximum in weightlifting. As the research landscape evolves overtime, the Olympics Research Trends Dashboard will update in real-time providing a powerful hub for researchers, athletes, coaches and sports fans, to follow the cutting edge research around their favourite sport.
In the dashboards for each sport, we have featured top research institutions, leading journals and academic publishers who provide the underlying infrastructure for conducting research and its subsequent dissemination. According to our analysis, Taylor & Francis, closely followed by Elsevier lead as publishers of most sports related research papers across their journals.
Among countries, USA alone has published more research papers (13,557 publications) as compared to the next 4 countries altogether which include UK, Australia, Japan and Canada (12,800 publications altogether). For those excited to stay on top of the current research happenings, you can browse through the latest publications in each field within our dashboards.
This Olympics Research Trends Dashboard provides an unprecedented resource for the Sports Science research community specialising in each of the games to analyse the research landscape and monitor how it evolves overtime in future, more importantly for athletes and their coaches to stay ahead based on latest research. It is also a valuable resource for the sports’ fans around the world to appreciate and explore the extensive research that underpins players’ performances as we watch them compete in the Olympic games.
About wizdom.ai and colwiz:
colwiz, a startup from the University of Oxford’s Isis Incubator, recently announced wizdom.ai (details in our blog post here), the world’s largest research knowledge graph powered by big data analytics, machine learning and artificial intelligence. wizdom.ai contains 2.7 billion factual data points, interconnected with 78 million publications, 700 million citations, 50 million researchers, $700 billion in research funding, 60,000 journals, 50,000 institutions, 289 million concepts and 150 terabytes of web crawl data. Our previously launched Brexit Dashboard was featured in the WIRED magazine and Fast Company and shared widely on Twitter and Facebook – people from 1700+ cities in 120+ countries visited our site to explore our dashboard.
Through our dashboards, we provide a glimpse into the powerful capabilities offered by wizdom.ai – you can see the full list of features for researchers, publishers, institutions, funding bodies, businesses and governments on our website.
Prior to its official launch, we will be giving an early preview of wizdom.ai to a limited numbers of researchers, research groups, universities, organisations, funding bodies, publishers and government agencies. Individuals can sign up for an early preview on wizdom.ai to get an insight into our latest developments. If you are an organisation, reach out to
- Sadia Shahid, Head of Strategy, sadia.shahid@colwiz.com
- Tahir Mansoori, CEO & Founder, tahir.mansoori@colwiz.com


